
Stock price performance can shed light on how consumer goods companies are faring in the new normal and which industries are proving more resilient. Overall, the stock market has recovered positively since the low of 23 March. The SP500 index, for example, was up 3.0% on 21 October compared to the pre-COVID peak in February, and stock prices for 23 out of 42 consumer goods companies in our sample were above pre-COVID levels, despite lingering uncertainty. Food, beauty and home care companies appear to weather the current environment better, while the alcoholic drinks market remains subdued.
Stock Market Response to COVID-19 for Selected Key Companies: 23 March and 21 October Relative to February 2020 Peak
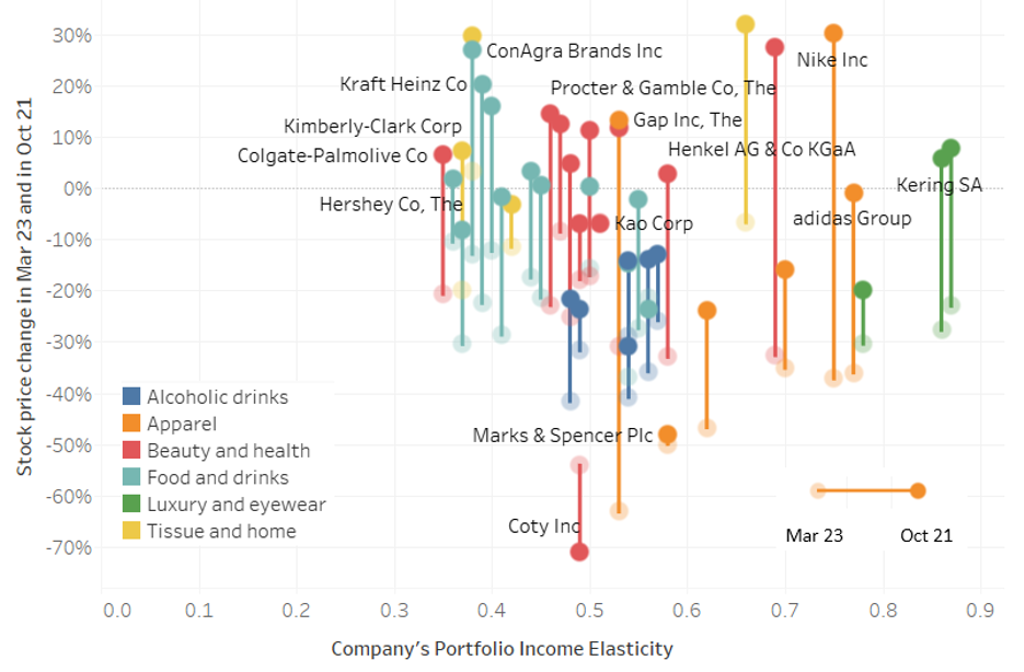
Note: 0 line at y-axis indicates pre-COVID level which is set to 21 Feb 2020. The Y-axis shows stock price performance at two periods – 23 Mar 2020, which was the lowest level for stock prices (indicated by a lighter circle on the chart), and 21 October (darker circle on the chart). Both are relative to 21 Feb 2020. The X-axis shows the company’s portfolio income elasticity – how volume sales change relative to GDP change.
Source: Stock prices from Yahoo Finance! and company elasticities from Euromonitor International.
Income elasticity predicts initial stock market decline well
In April 2020 Euromonitor published an article looking at key FMCG companies and their portfolio risk in the COVID-19 environment, on the basis of a company’s portfolio income elasticity. Income elasticity measures how category volume sales would decline in response to 1% drop in real GDP; for example, a category with an income elasticity of 0.2 would drop by 0.2 percentage points in response to a 1% drop in GDP, while a category with an income elasticity of 1.5 would drop by 1.5 percentage points in response to a 1% drop in GDP. The idea is that companies tailored towards more discretionary spending categories (higher income elasticity) would decline more, as consumers cut back on spending on non-necessary goods, while companies tailored for necessity products such as food (lower income elasticity) would weather the current environment better, as demand is more predictable.
Income elasticity showed strong correlation in March, in the initial stock market sell-off, when the decline in the stock market could be linked to how risky a company’s portfolio looked on the income elasticity spectrum. Now with more than half a year in the new normal environment, we see a more complex story reflecting various degrees of social distancing adopted by countries, which have impacted on-trade, as well as different fiscal stimulus measures.
COVID-19 performance by industry
The following charts put consumer goods companies in six clusters – beauty and health, food and drinks, alcoholic drinks, tissue and home, apparel and luxury/eyewear – and compare their performance in spring (23 March) and autumn (21 October) of 2020, from a stock market standpoint along the predicted company elasticity.
Beauty and Health: Outlet-based companies recover in summer
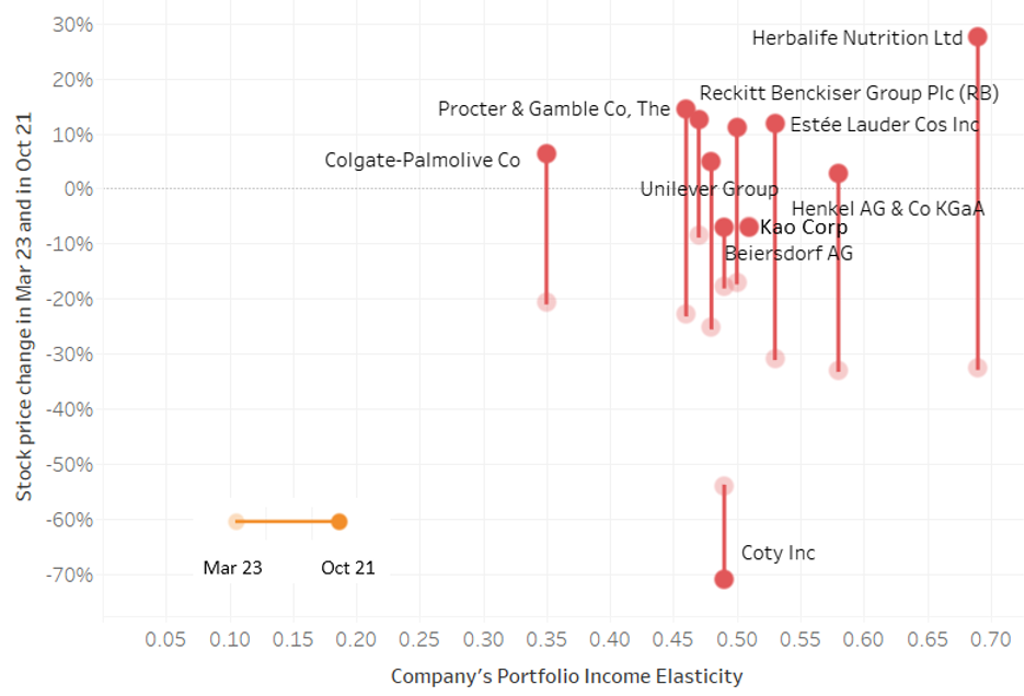
Source: Stock prices from Yahoo Finance! and company elasticities from Euromonitor International.
Overall, the beauty industry has weathered the current COVID-19 environment quite well. By October, most companies appear to have recovered from declines in spring, with many above pre-COVID peaks by as much as 10-20%. For example, Procter & Gamble was up 15% in October, compared to a 23% drop in March.
In March, Colgate-Palmolive was among the best performers in the sample, along with Reckitt Benckiser as indicated by their lower income elasticity. By October, however, many companies with more elastic portfolios had recovered and overtaken them.
Outlet based specialists, selling through branded stores, such as Estée Lauder and Herbalife, initially struggled in spring, but have posted some of the biggest gains since March. The only company that has seen a worse performance in October compared to March is Coty, which continues to struggle with its turnaround plan and has yet to benefit as much from the recovery.
Food and Drinks: Stable but with limited upside beyond a few outperformers
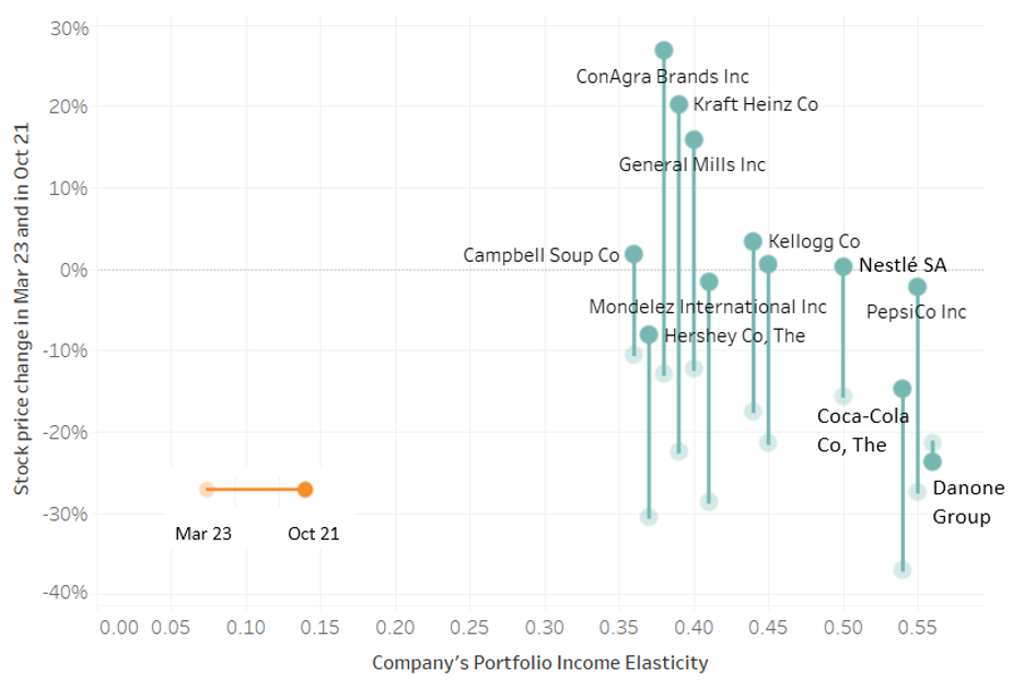
Source: Stock prices from Yahoo Finance! and company elasticities from Euromonitor International.
In packaged food, the story is more mixed, owing to disruption in the on-trade channel especially. The income elasticity of most food companies is typically low. Food is a necessity product and consumers continued to shop through lockdown measures – even stockpiling some products early on – thus avoiding initial declines.
Coca-Cola was one of the most affected companies in spring, hurt by its dependence on the on-trade, leaving the company 37% below the pre-COVID peak, but has since recovered, although still remains 15% below pre-COVID levels. PepsiCo has fared better, due to greater balance of snacks vs on-trade drinks in its portfolio.
Necessity food companies like Kraft Heinz, ConAgra Brands and General Mills have performed the best in this group, posting 10-20% gains by 21 October. Danone, in contrast, remains lower than where it was in spring, but that’s more to do with company re-organization in response to declining dairy consumption trend rather than pandemic environment.
Alcoholic Drinks: Social distancing limits on-trade recovery
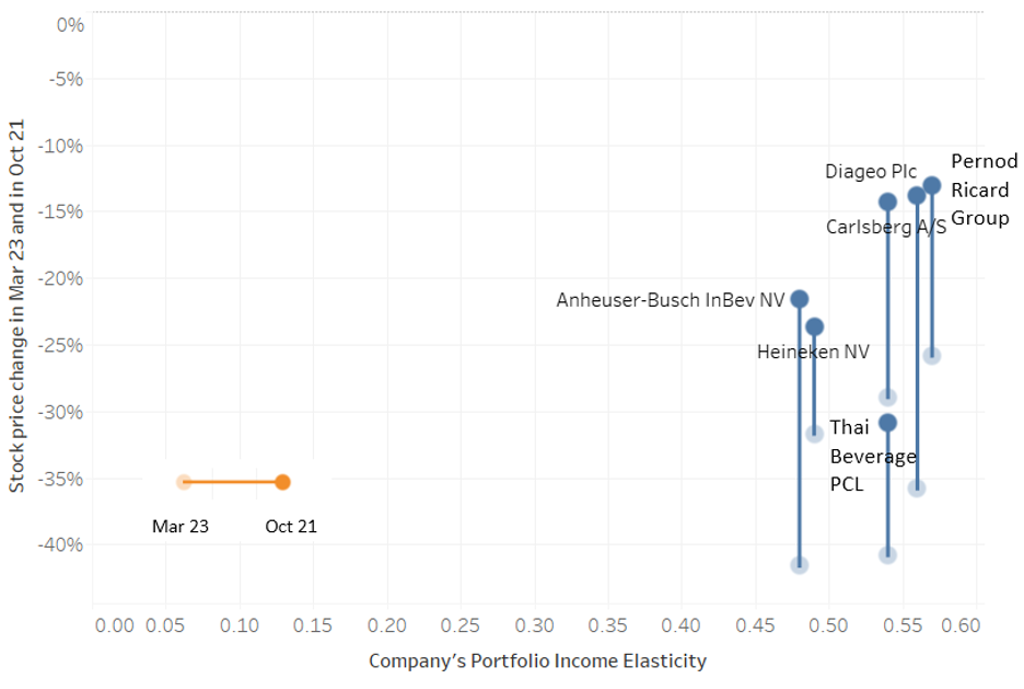
Source: Stock prices from Yahoo Finance! and company elasticities from Euromonitor International.
Alcoholic drinks continues to struggle, with all companies in the sample remaining in the negative, yet to return to pre-COVID levels. The world’s largest brewer, Anheuser-Busch InBev has recovered from a 42% drop in spring but is still 22% below the pre-COVID peak. The spirits focused Diageo and Pernod Ricard companies appear in better shape, along with Carlsberg, which was helped by its exposure to the Chinese market, where restrictions were lifted sooner.
Although categories like beer do not have high-income elasticity, social distancing measures have put the brakes on on-trade recovery, and consumers remain more cautious visiting bars, while many bars continue to have seating restrictions or limited opening hours. Thus income elasticity for this industry shows less direct correlation, being more responsive and susceptible to the impact of social distancing measures.
Tissue and Home: Continued positive performance
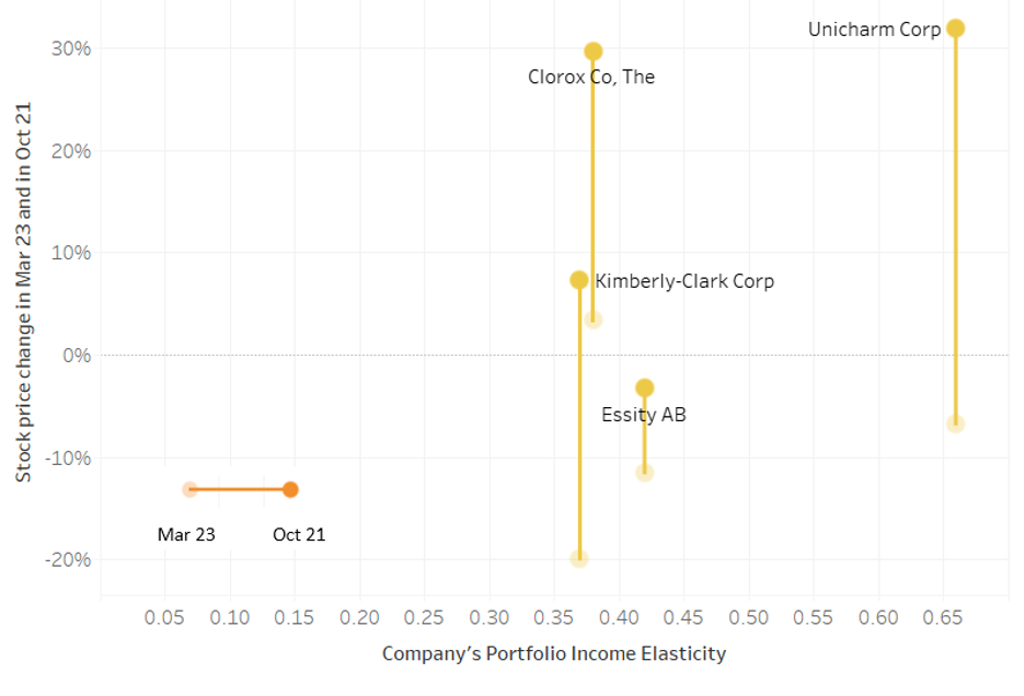
Source: Stock prices from Yahoo Finance! and company elasticities from Euromonitor International.
Tissue and home was one of the best performers in spring. Clorox is a notable example of a counter-cyclical company, rising 3% in March when pretty much everything across the board dropped, as demand for home care products surged. Demand has not abated, and Clorox was 30% up 0n October 21.
Kimberly-Clark, the world’s largest tissue company, dropped 20% in spring, despite the high share in categories such as toilet paper, which had a stockpiling boost. By October, the company was up, however, as demand for other company products like diapers also recovered. Unicharm, a Japanese tissue company had the best turnaround since spring and was up 32% owing to recovery in Japan, China and Southeast Asian markets. On the other hand, Essity, a Swedish company focused on tissues remained -3% lower than pre-COVID peaks in October.
Apparel and Footwear: Some of the largest turnarounds since spring
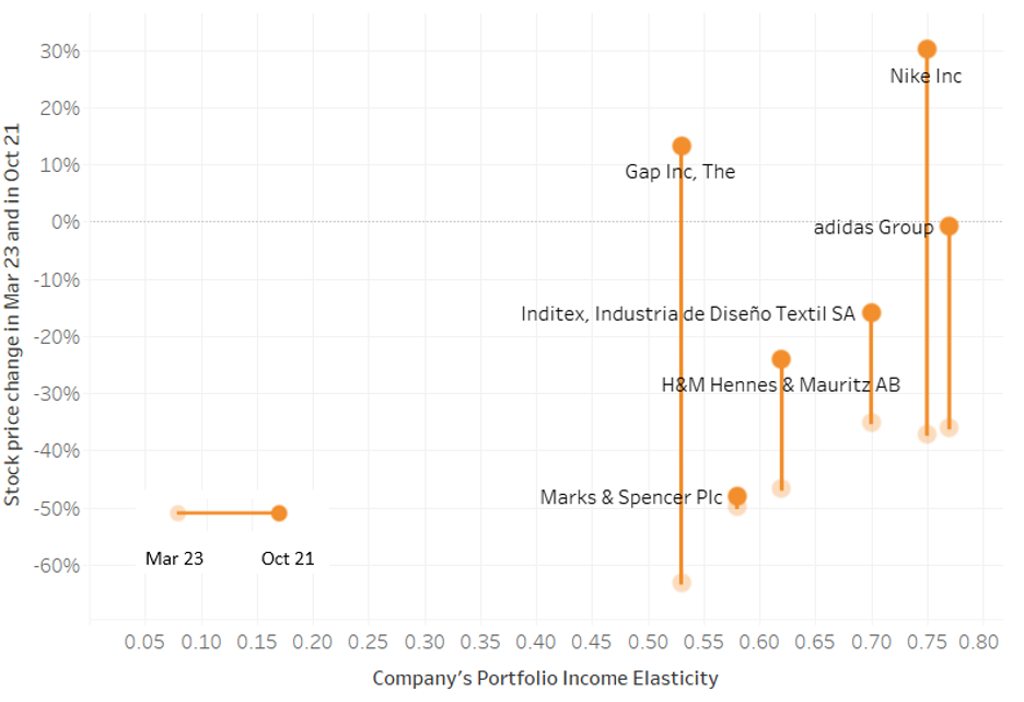
Source: Stock prices from Yahoo Finance! and company elasticities from Euromonitor International.
Apparel and footwear has the highest income elasticity among consumer goods. As a result, all companies dropped significantly in spring – both because of high elasticity and also because the majority of companies continue to rely on stores which were closed. For example, GAP was down 63% in spring, while Nike and Adidas dropped 37% and 36% respectively.
There have been remarkable turnarounds in the industry since spring, as stores have reopened. Nike is one of the most impressive performers, coming back from -37% to a 30% gain. GAP is another impressive recovery, which looked like it was bordering on survival in spring, but has now risen back to a 13% gain over pre-COVID levels (21 February). Marks & Spencer remains subdued due in part to Brexit uncertainty.
Luxury: Demand back up but sunglasses demand remains lower
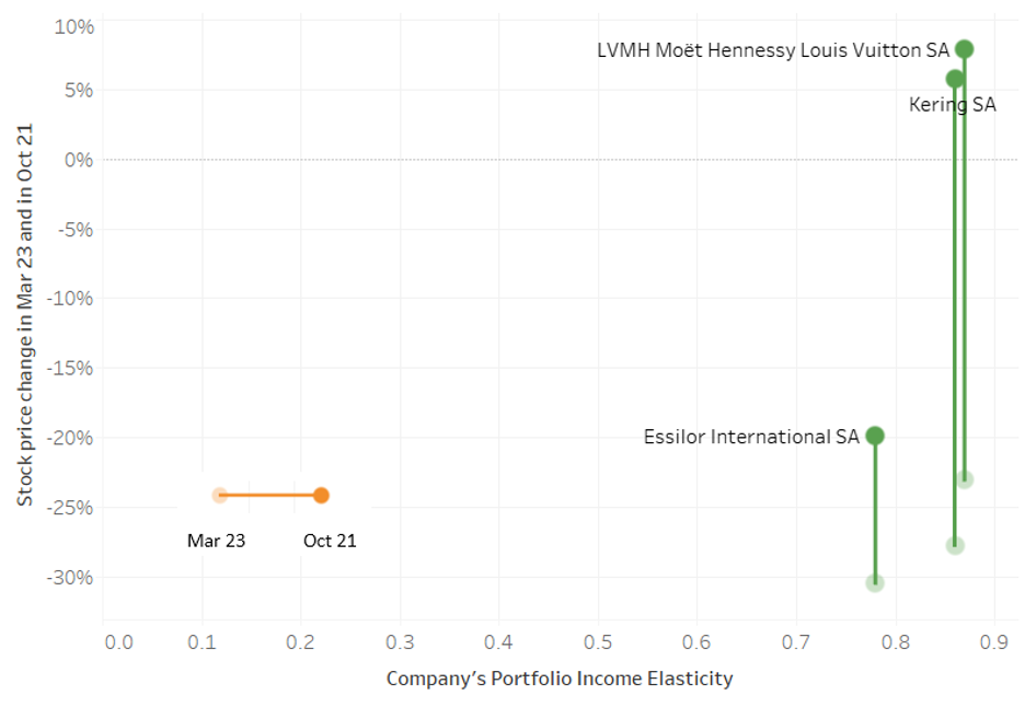
Source: Stock prices from Yahoo Finance! and company elasticities from Euromonitor International.
Luxury is the smallest industry in our sample but the most elastic, which is reflected in its drop and recovery, although not as remarkable as in apparel. LVMH and Kering, two of the world’s largest luxury companies, have recovered from declines in spring. This compares to the performance of the beauty industry, as both are focused on specialist stores.
Essilor Luxottica remains 20% down in October as demand for sunglasses remains low, due to the impact of the pandemic on travel.
Consumer goods resilient but this depends on stores remaining open
Overall, stock market performance has shown a clear recovery over summer, but the stark difference in company positions in March vs October shows the obvious importance of store closures and event cancellations in addition to economics. While the majority of store-based companies have reversed declines over the summer, store closures remain the biggest risk in a second pandemic wave.
The negative economic impact appears to have lessened over the summer, as even industries with high income elasticity like apparel and luxury appear to have recovered, as pent up demand was unleashed in summer. From the consumer standpoint, generous government stimulus packages, as well as monetary support measures by the Fed and others have clearly contributed to confidence.
In the event of a second pandemic wave, the reversal from spring could be hard to maintain, and those companies showing the highest reversals could be at risk of potential decline. Even companies which would typically do well in an economic headwind environment like McDonald's have not done well early on, as the stores had to close, and remain at risk in event of further closures. One trend that has emerged is the importance of the online channel which is likely to remain prominent in winter.