
The world is home to thousands of cities, but only a select few hold global significance. Based on the expert judgement of financial, political, economic and cultural influence, a list of 10 cities was chosen: New York, London, Paris, Tokyo, Hong Kong, Singapore, Chicago, Los Angeles, Beijing and Washington D.C.
The goal is to gauge a deeper understanding of their similarities and differences across a range of socio-economic factors including affordability, incomes, economic growth and income inequality.
Economy
Source: Euromonitor International from national statistics/Eurostat/OECD/UN/International Monetary Fund (IMF), International Financial Statistics (IFS)
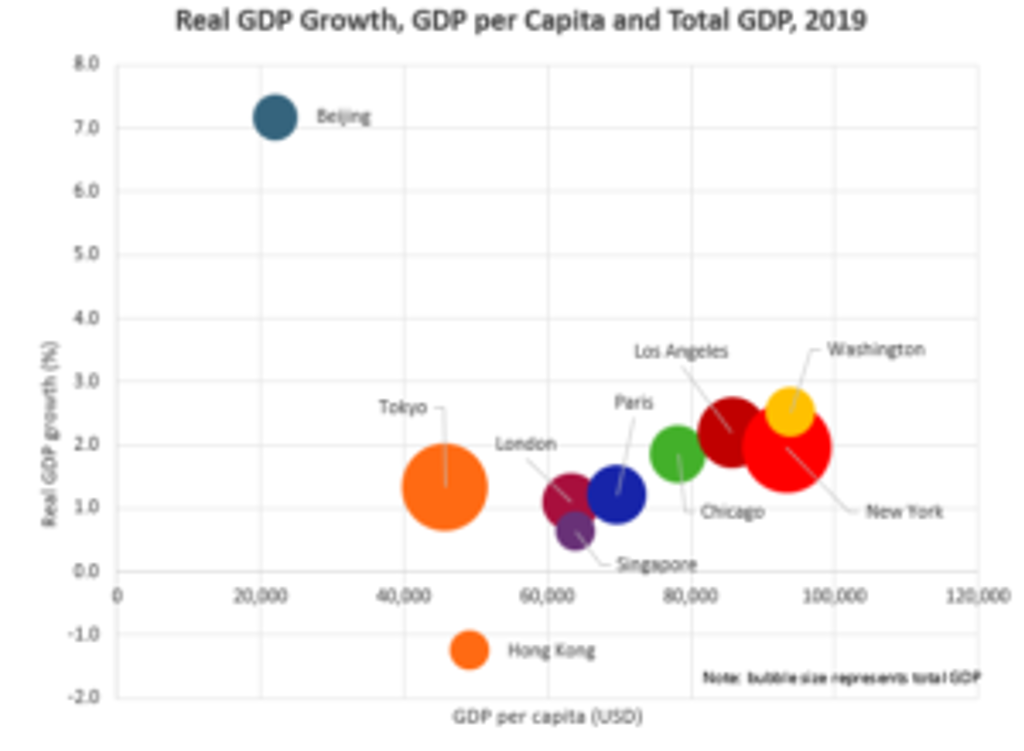
GDP per capita, a popular wealth measure, varies considerably between the 10 influential cities – from just over USD20,000 in Beijing, to just under USD94,000 in Washington DC and New York. Washington D.C.’s substantial dependence on high value-added engineering and technology industries contributes to its elevated levels of wealth and labour productivity, while New York, which is not far behind Washington DC in GDP per capita terms, benefits from a strong financial sector.
While Beijing’s GDP per capita was a little over USD20,000 in 2019, the city has made tremendous progress, after seeing GDP per capita grow by 146% (constant value terms) in the period 2009-2019. This is largely thanks to increasing emphasis in finance, with Beijing among the top 10 financial centres in the world as according to the Z/Yen Global Financial Centres Index (GFCI) in 2019.
Incomes
Source: Euromonitor International from national statistics
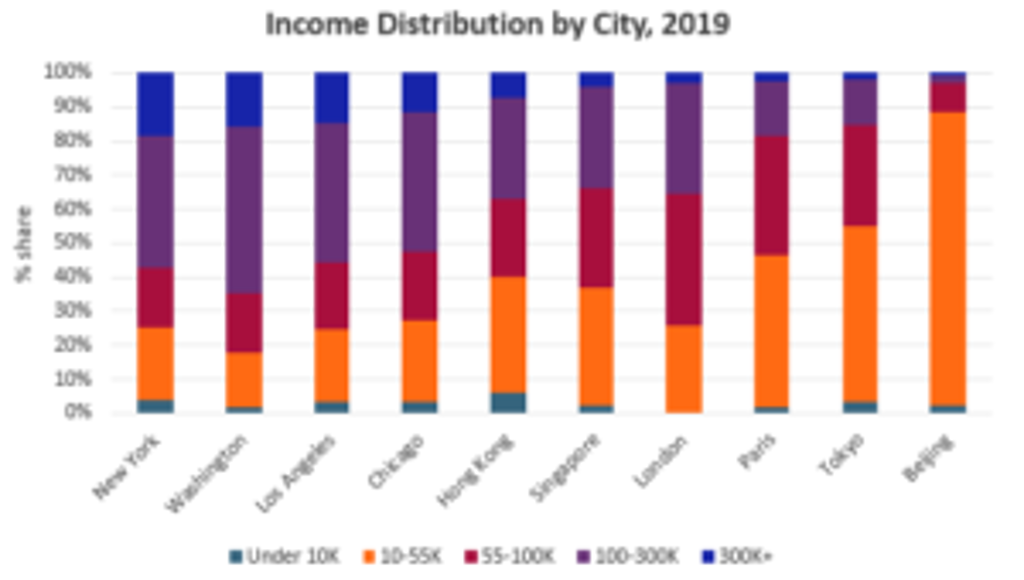
New York has the largest share of highly affluent households (households with disposable incomes greater than USD300,000 per annum). This is unsurprising given average household disposable incomes in the US’s largest city stand at USD67,800, making its population the richest among major cities.
At the other end of the spectrum, Beijing, with an average disposable income of USD13,800 falls considerably short of the income levels compared to other advanced economies with most of its households in the USD10,000-USD55,000 income bracket.
Affordability
Source: Euromonitor International from national statistics, UN OECD, Eurostat
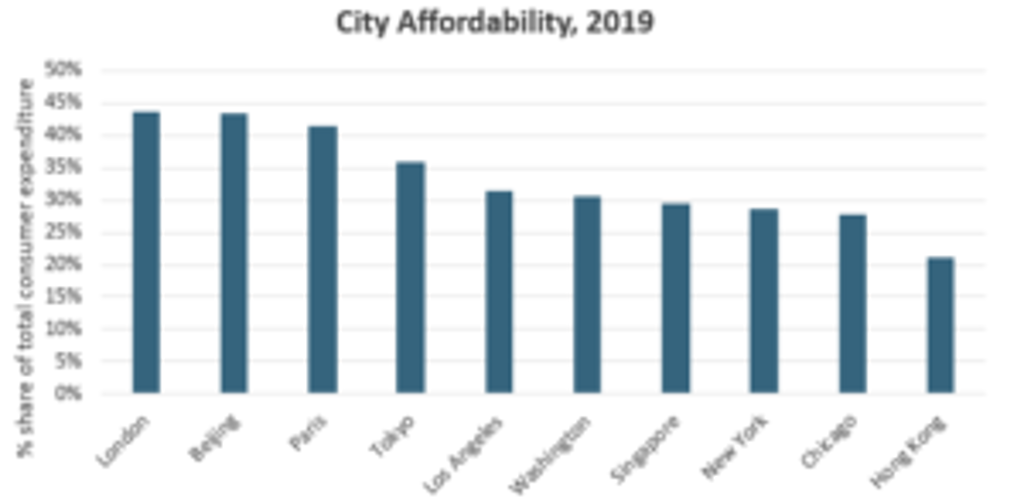
Affordability is measured based on consumer expenditure on housing and transport as a share of total consumer expenditure. Housing costs ordinarily rise as demand for space surges and this is usually symptomatic of economic success in cities (the lure of highly paid jobs attracts migrants).
In terms of transportation, inner city areas can become too expensive for people to rent or buy, and this results in people moving further out thus raising travel costs. London stands out as the most expensive city based on the affordability measure. The city is renowned for having some of the most expensive housing in the world, pushing people to city outskirts, thus elevating public and private transport costs.
Education
Source: Euromonitor International from national statistics, UN
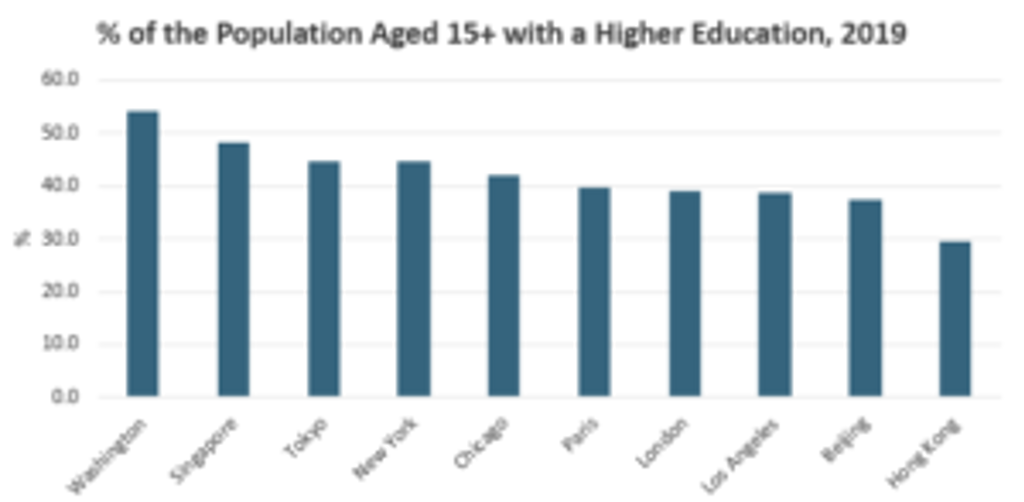
An educated workforce is indicative of a well-developed education system, but also the quality of human capital on offer. Washington DC is one of the few cities in the world to have more than half of its population aged over 15-years-old with a university degree education. The city is home to several universities, including Georgetown University and the George Washington University.
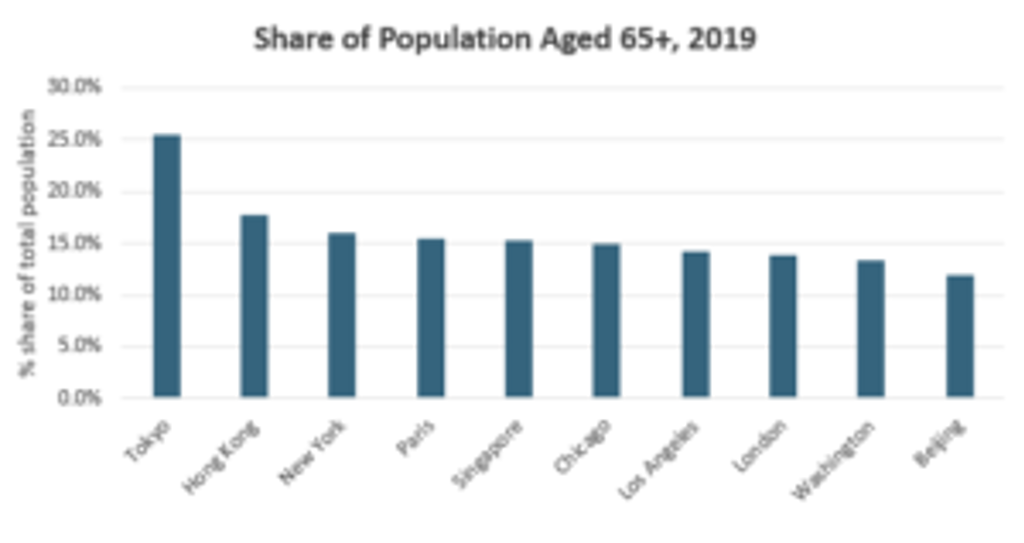
Demographics
While Tokyo, with 37.5 million people, is the undisputed global leader in terms of population size, it faces a struggle given its highly aged population. Population ageing is a challenge for Tokyo and something that could potentially reduce the city’s ability to compete as a future influential global city.
Younger cities such as Beijing and Washington are in a better position to drive future economic growth as the availability of young labour can help replace the older population going into retirement.
Source: Euromonitor International from national statistics, UN
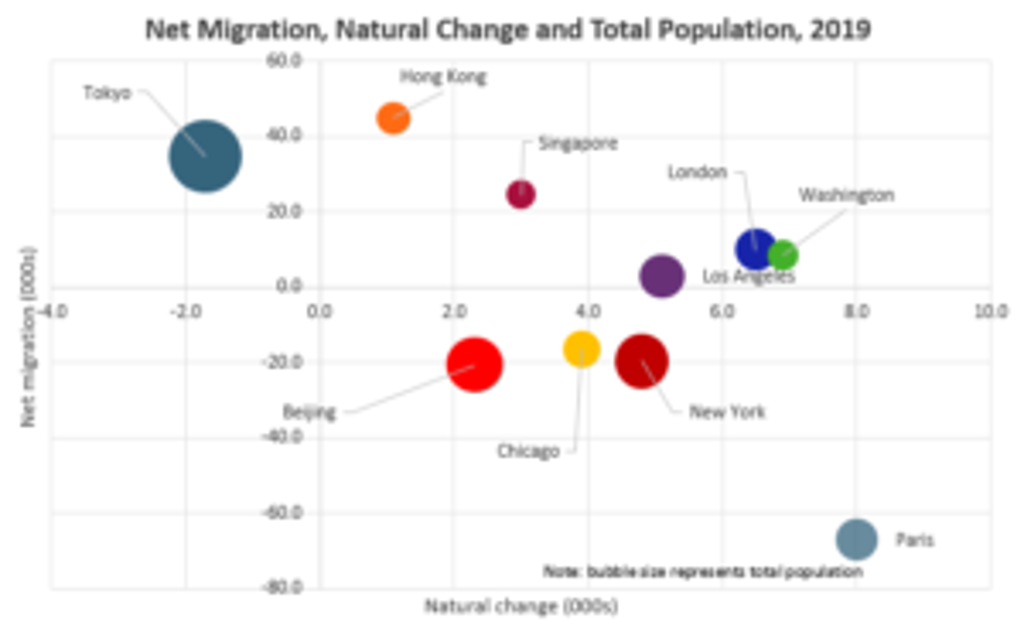
Source: Euromonitor International from national statistics, UN
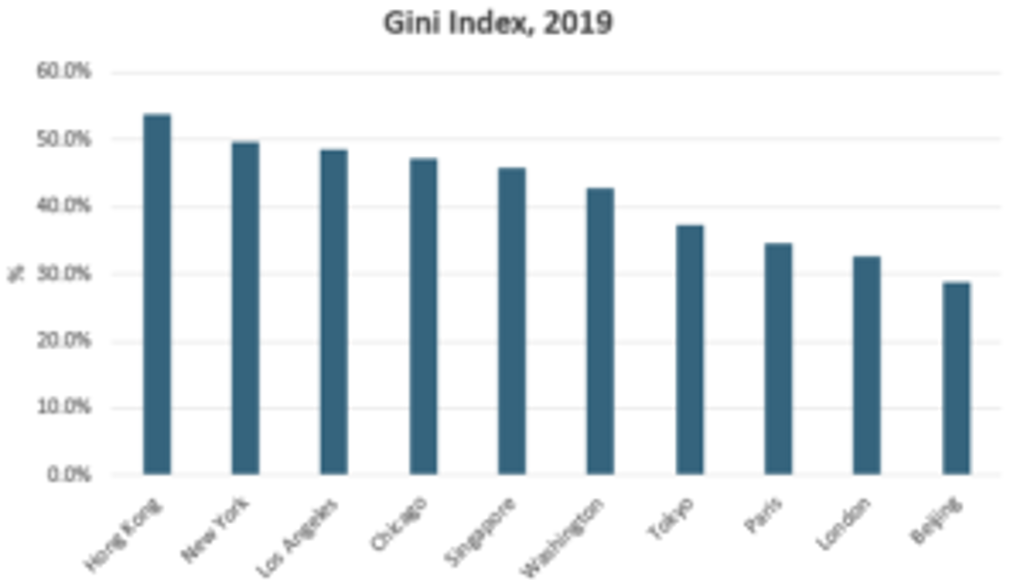
Income inequality
Source: Euromonitor International from national statistics
Income inequality, as measured by the Gini index (based on an index of 0-100 where 0 is perfect equality and 100 is perfect inequality) is rife in cities such as Hong Kong and New York.
The former contains the third-largest concentration of individuals worth more than USD30 million after London and New York. Subsequently, the locals in Hong Kong are being pushed out by the wealthy who can invest in properties, thus raising rents and nominal house prices.
London has made progress in reducing income inequality thanks to growing employment and incomes of the 10th percentile (low-income households) coupled with earnings losses of the 90th percentile (high-income households) especially during the financial crisis of 2008-2009. Its Gini index has fallen from 40.5% in 2014 to 32.7% and according to forecasts, it should continue reducing through to 2024 with the Gini index reaching 30.9%.
The world’s influential cities have varying challenges to contend with
The world’s most influential cities all have their challenges: some suffer from low levels of economic growth, while others are trying to overcome demographic hurdles.
It is hard to predict if the same 10 cities will still be as influential in 100 years’ time as they are today, especially given the ascent of emerging market cities such as Delhi, Mumbai and Shenzhen. It will lead to a shift of power from advanced economies in the west to the fast-growing developing markets of the east.