

In 2021, demand for lipstick in the US notably improved as COVID-19 mask restriction requirements and lockdowns relaxed. The momentum behind lip products is expected to be bolstered by consumers looking to refresh their existing lip inventory after years of limited use and new trends. Following a 27% decline in retail sales in 2020, sales in 2021 grew by 16% and in 2022 are expected to grow by 14% to reach USD2.8 billion or near to 2019 pre-pandemic levels. With increased cost-push and demand-pull inflationary drivers in lipstick alongside all beauty goods, lipstick suppliers’ pricing strategies and functional benefit claims are critical for standing out in a highly competitive field. Using Via, Euromonitor International’s e-commerce tracking tool, online prices and product availability of stock keeping units (SKUs) for the category and leading players (including private label) can be easily tracked and compared to understand:
- How have prices and availability fared for the industry and leading players, including private label?
- How are claims being positioned differently and providing key pricing advantages?
- What functional claims have been most well-received throughout 2021?
Online lipstick product availability and prices in flux throughout 2021
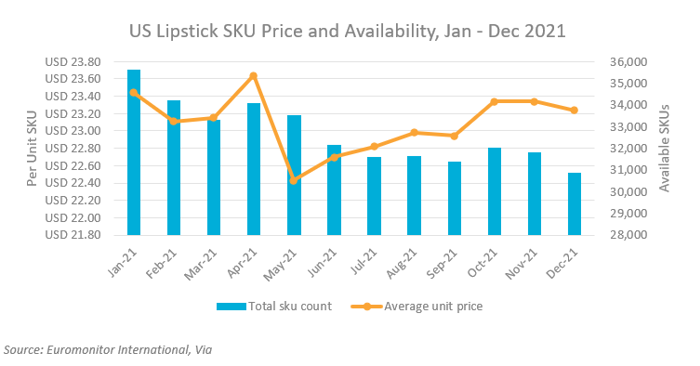
- Within the US and throughout 2021, lipstick experienced strong fluctuations in terms of price and availability. For this online sample of lipstick, SKU prices for the entire category fluctuated, particularly around April and May, but prices for this online basket were relatively similar in December compared to January with per unit SKU prices declining by just 0.9% to USD23.23. However, this is largely due to availability issues and the totality of the basket of goods being observed. Taking a closer look at leading players in the next section indicates how prices have generally risen due to inflationary pressures.
- A more revealing statistic for lipstick in the US was the impact on available SKUs seen in the blue columns above. Due to supply chain issues, consumer demand drivers and company product portfolio decisions, the number of available SKUs significantly declined from January to December, dropping by 13% from the start of 2021. Several leading players including Revlon cited difficulties with procuring necessary ingredients during this time and that competition for available materials was also challenging.
Leading brands in lipstick see prices rise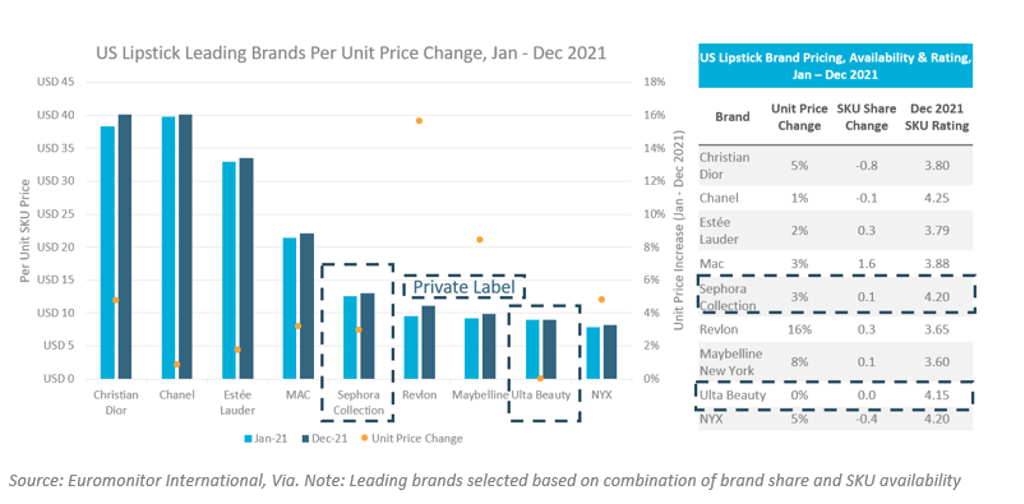
- Within this basket of SKUs, with the exception of Ulta Beauty, all leading brands witnessed unit price increases from January to December 2021. Online product portfolios of mid-tier/mass brands Revlon and Maybelline witnessed the highest increases in unit prices of 16% and 8%, respectively. Despite supply chain procurement issues, both brands experienced an increase in availability of SKUs throughout the year compared to the total number of lipstick SKUs being tracked in the US. However, while Maybelline’s price increases appear to have been tolerated by consumers, Revlon’s were not and its sales of lipstick struggled in 2021 due to changing consumer preferences alongside supply chain disruptions, resulting in the company filing for bankruptcy in June 2022.
- Private label lines such as Sephora Collection and Ulta Beauty witnessed little change in pricing for their portfolios during 2021. As Sephora’s sales strategy is to maintain prices and not actively launch products, its modest 3% increase in online prices is due to changes in the different products being stocked at various retailers as the majority of its individual SKUs did not see price rises. Ulta Beauty’s strategy of not raising its prices has been successful as the company reported very strong earnings in 2021 as consumers’ beauty purchases increased. Furthermore, as clear from the table to the right, while these private label lines offer lower prices, consumer satisfaction is high as both enjoy strong consumer satisfaction scores based on online ratings. Additionally, these private label lines offer consumers entry points into categories, therefore maintaining prices helps make these lines accessible for consumers still new to the category.
Functional benefits support rise in lipstick
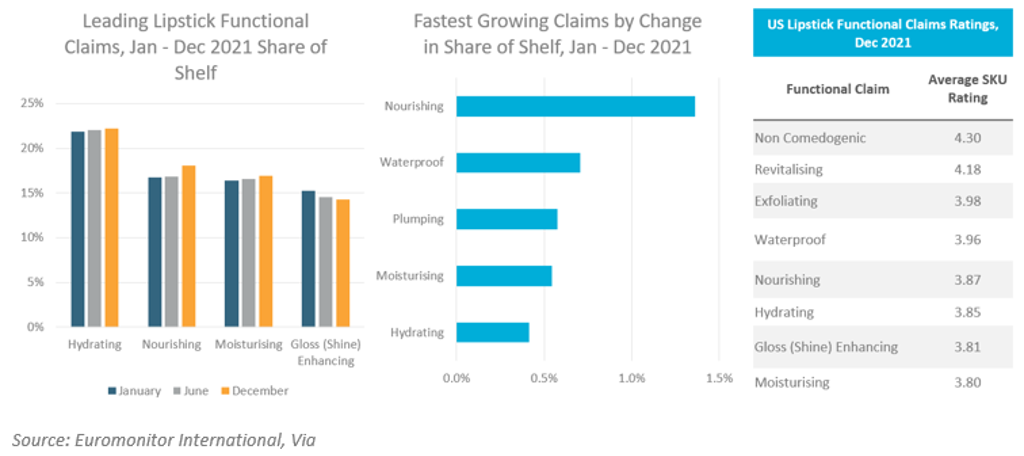
- With the exception of gloss (shine) enhancing claims, the leading functional claims of hydrating, nourishing and moisturising experienced an increasing share of SKUs. Outside of the larger claims, lipstick with waterproof and plumping functional claims witnessed large increases from January to December 2021. The “skinification” of is making its way into colour cosmetics, with consumers eagerly adopting lipstick products that combine nourishing benefits but also ingredients most commonly found in skin care.
- Utilising self-reported online satisfaction claims from various retailers, lipstick with non comedogenic and revitalising claims had the highest satisfaction scores from online shoppers at the end of 2021. Non comedogenic claims refer to lipstick that claims to use ingredients that do not block pores and are helpful for sensitive and acne-prone skin. While this claim was not widely available in the sample being observed, it is one to look out for in the future as the brand Kiko Milano offers several SKUs with non comedogenic claims that score highly in customer satisfaction ratings.
Price positioning and consumer reaction vary greatly across brands
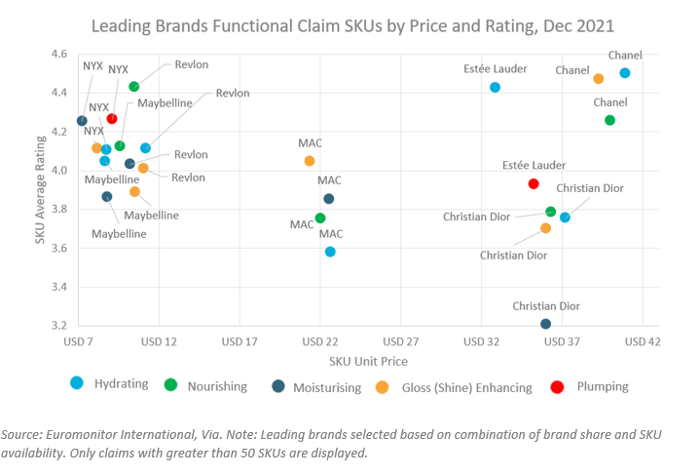
- Chanel’s lipstick range has the highest overall rating of leading brands being observed in this sample. However, its hydrating SKUs in particular had the highest rated satisfaction by consumers by the end of 2021 with SKUs having an average rating of 4.50. These products also had the highest average unit price of all products being observed, indicating consumers’ appreciation of the value being received despite the high price points. Similarly, Estée Lauder is another brand where its lipstick with hydrating claims received strong consumer satisfaction compared to its other products. However, mid- and lower-priced brands such as MAC and NYX saw the opposite trend with their hydrating claims being less well-received by consumers, indicating the importance of monitoring how the individual claims of each brand are received by consumers alongside their price positioning.
As consumers and companies struggle to adjust to new inflationary pressures, monitoring online prices, availability and ratings for select categories and baskets of goods provides key insights into how price increases are manifesting themselves across categories, companies and pack sizes and how consumers are reacting to these changes. Companies need to closely track these changing online metrics from a variety of perspectives in order to track competition and identify pricing advantages and opportunities.
Learn more about how Via can support your business and help you unlock key strategic and tactical insights with its standardised online product coverage across 80 countries, 2,000 online retailers and 11 consumer goods industries.
Note: Sample based on SKU prices found in Euromonitor International’s e-commerce tracking tool Via with data extracted in August 2022. Please note that due to ongoing improvements to the AI-led product matching of SKUs to categories, supplier, and brands, data and SKU counts can be revised based on system updates. SKU counts used for the analysis include: Total US Lipstick SKUs (January = 35,589, December 30,844). SKU information extracted from the following e-commerce retailers: Amazon, ASOS, Birchbox, Bloomingdale's, Blue Mercury, Boohoo Chanel, CVS, Dillard's, Dior, Estée Lauder, Feel Unique, Harris Teeter, Hy-Vee, iHerb, JC Penney, Kmart, lookfantastic, MAC Cosmetics, Macy's, Maybelline, Net-A-Porter, NYX Cosmetics, Safeway, Saks Fifth, Avenue, Sally Beauty, Sephora, SkinStore, Target, TJ Maxx, Ulta, Walgreens, Walmart, W