
The US has introduced a new round of Trump tariffs, keeping tariff pressure in place after the previous temporary 10% global duties expired on 24 July 2026. For many major economies, the headline rate has not changed; the bigger shift is that the tariffs now sit on a more durable framework, with some partners facing higher 12.5% rates.
Most economies that have committed to prohibiting forced-labour-produced goods face the lower 10% rate, while those judged to have done less, including China, Vietnam, Japan, South Korea, Australia, and Thailand, face 12.5%.
Source: Euromonitor International
For Japan, South Korea, and EU members, the mechanism tops existing duties up to one of those two ceilings rather than stacking on top of them, but for most goods in most markets, the direction is uniform: access to the US market has become more expensive in the long term.
Sector and country-specific tariffs add further layers of cost
These duties do not stand alone. Sector-specific tariffs on steel, aluminium, copper, motor vehicles and parts, and microchips remain fully in place. Brazil faces a separate 25% tariff on multiple goods – from furniture and footwear to sugar and machinery – imposed following a yearlong investigation into alleged unfair trade practices.
Canada faces an additional 50% tariff from 19 August on multiple export categories, including alcohol, dairy products, furniture and textiles, though cars, energy, potash and critical minerals are excluded. Most structurally significant is the US decision not to renew the USMCA on 1 July, converting it into a decade of annual reviews – a permanent renegotiation that makes long-term investment decisions across North American supply chains considerably harder to plan.
China already carries a stack of Section 301 duties ranging from 7.5% on consumer goods to 100% on electric vehicles. The new 12.5% baseline adds to that stack, making China the most tariff-exposed origin market in the US import system across consumer electronics, industrial goods, and apparel. Supply chain diversification away from China has been accelerating for several years as a result; the new duties reinforce that direction, compressing the window for categories where Chinese production has remained competitive despite earlier levies.
Countries with the highest US export exposure feel tariffs most
US tariffs are expected to have a different impact on exporting countries, depending on two factors: the share of their exports going to the US, and how much those exports contribute to GDP.
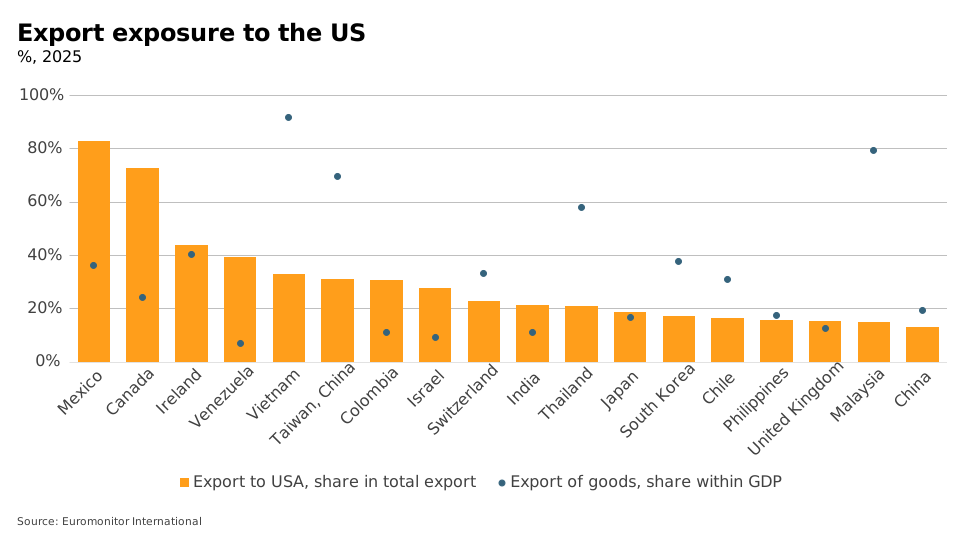
Vietnam ranks among the most exposed exporters, with a high share of exports going to the US and a high dependence of GDP on exports. Its export base – electronics assembly, footwear, apparel, furniture, and machinery – flows predominantly to the US, its largest market by far. That structure grew partly from supply chains shifting out of China during earlier US-China tariff disputes. At 12.5%, the cost advantage that made Vietnam an attractive alternative is now compressed.
Mexico's exposure is different in character. The 10% tariff applies only to goods that fall outside USMCA rules of origin, but the treaty's non-renewal has increased uncertainty. Mexican manufacturing is deeply integrated into US automotive supply chains, so the uncertainty from annual reviews may result in deferred investment, hesitant supplier commitments, and quiet recalibration of sourcing strategies.
New tariffs to affect consumer prices in the US
Electronics and electrical equipment carry some of the deepest cumulative tariff exposure of any import group across smartphones, laptops, televisions, and household appliances. These products rely on Asian supply chains whose component geography follows the product regardless of where final assembly occurs, so Chinese-origin parts in a device assembled in Vietnam still attract duty. Rerouting supply chains this complex takes years, meaning tariff costs will pass through to retail prices more fully than in almost any other category.
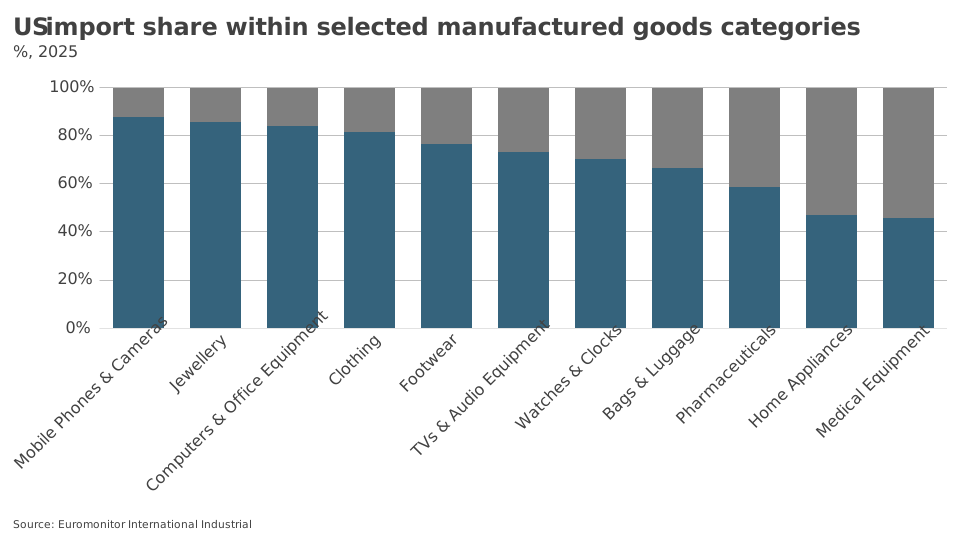
Apparel and footwear tell a similar story through a different supply chain. China and Vietnam, both at 12.5%, and Bangladesh, at 10%, together supply most of the clothing and shoes sold in the US market. Brands and retailers sourcing from these countries – particularly at the value end – operate on margins that leave little room to absorb a material increase in landed costs without adjusting retail prices. Consumers shopping for clothing basics are likely to feel this category’s tariff impact more directly and more quickly than most others.
Taken together, these measures leave the US economy facing a heavier, more durable tariff burden. Growth is likely to slow modestly as higher costs weigh on investment and spending, while inflation ticks up as tariffs pass through to retail prices – a squeeze felt hardest by lower-income households.
