
As companies around the world struggle with supply chain issues and the impact this disruption is having on inflation and consumer demand, it has become critical for companies to track online availability from a variety of perspectives to gain a more holistic understanding of supply chain performance.
While measuring the number and percentage of out-of-stock products provides a key indication of availability, this is not the only way to gauge supply chain performance, as often stock keeping units (SKUs) online can simply disappear on a website versus being labelled as out-of-stock. As a result, tracking changes and variation of available SKUs on websites on a monthly basis provides a key indication of stability alongside supply chain availability by way of out-of-stock performance.
Using Euromonitor International’s e-commerce tracking tool, Via, supply chain performance can be examined in a variety of ways - by country, category, company or retailer, and data across countries are organised to a standardised taxonomy of category definitions for like-to-like comparisons.
Here we will examine the 2021 beauty and personal care (BPC) supply chain performance across the leading e-commerce markets. With companies struggling to procure raw materials and competing for logistical resources for a competitive advantage, standardised global tracking has never been more important. Here we will examine:
- Which countries have seen low e-commerce out-of-stock rates alongside a stable supply of available SKUs
- How beauty and personal care product categories are performing across leading e-commerce markets at a global level
- How Amazon’s e-commerce availability has fared across beauty and personal care categories in leading markets
Companies can use this information to stay up to speed on changing supply chain dynamics to ensure their customers and potential clients have sufficient availability, as companies from around the world are increasingly competing for supply chain resources with both known and unknown competitors.
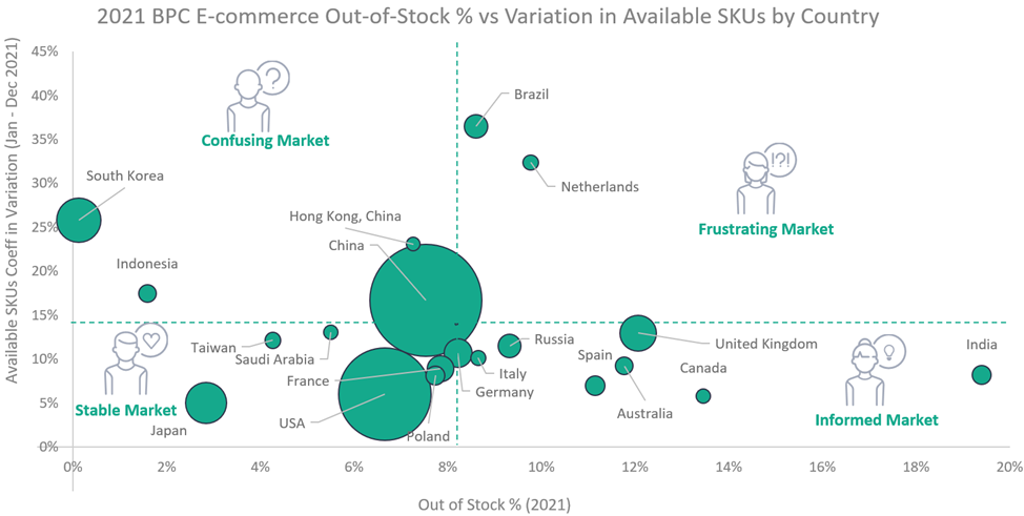
Japan had the most stable BPC e-commerce availability of the largest 20 markets in 2021
Source: Euromonitor International Via
Note: Averages based on totals for 20 largest e-commerce markets in beauty and personal care indicated by unlabelled centred dot.
Bubble size represents size of 2020 e-commerce BPC retail sales. Available SKU variation calculated by coefficient of variation, which measures dispersion around the average number of available SKUs by each country per month.
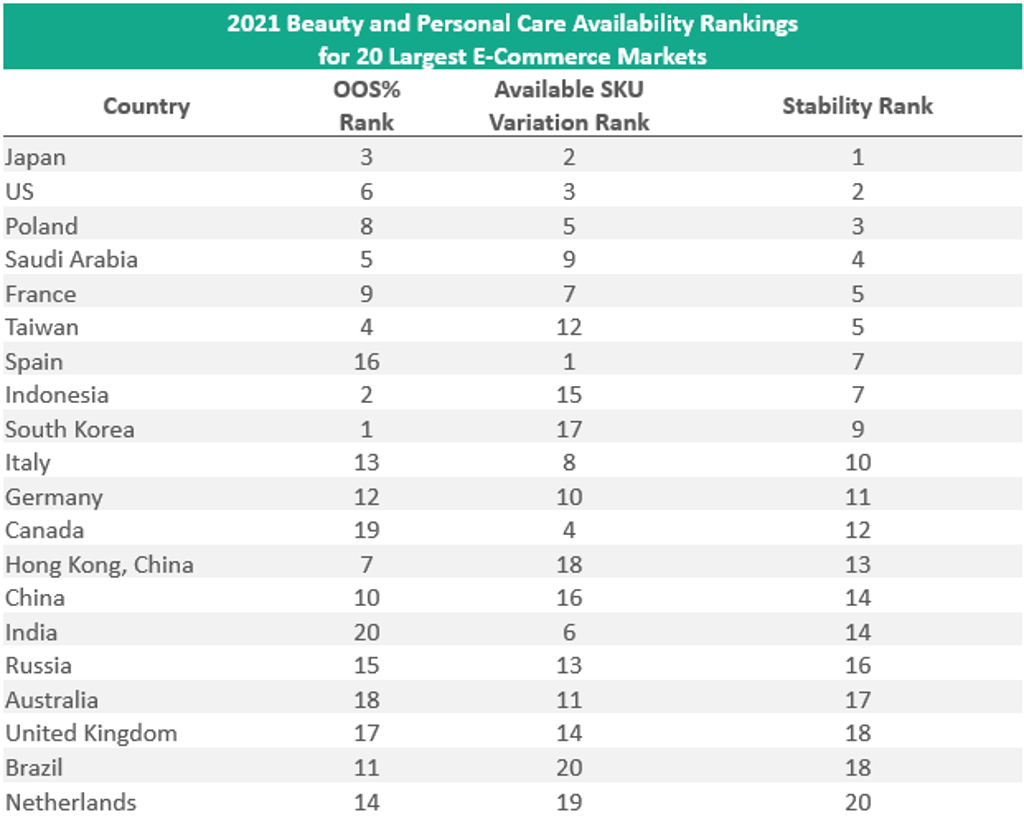
- Japan and the US were the largest e-commerce markets, with both lower than average OOS rates as well as variation in the availability of SKUs, giving consumers a stable e-commerce environment.
- China, the largest BPC e-commerce market, had lower than average OOS rates but a high variation in available SKUs, leading to a more confusing experience for shoppers compared to other markets.
- Companies competing in markets that have either high out-of-stock levels or strong variation in available SKUs must prioritise resources to ensure their supply chain network is not subject to the overall struggles within the respective country, as providing more stable availability can lead to a strong competitive advantage.
Fragrances and colour cosmetics are leading out-of-stock products globally
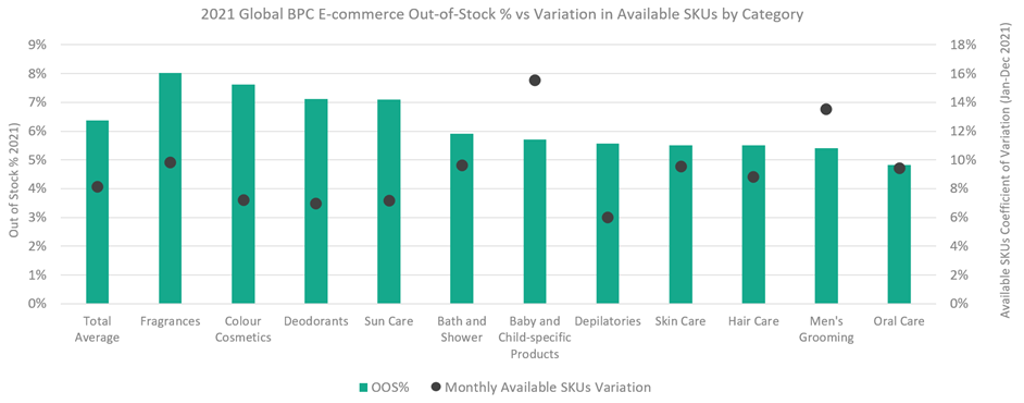
- Globally, across 40 markets covered in Via, the average out-of-stock rate for all beauty and personal care was 6%. However, fragrances, colour cosmetics and deodorants all had out-of-stock rates over 7%. Oral care was the least out-of-stock as the only product category lower than 5%.
- While out-of-stock measures the SKUs that are labelled on websites as being “out-of-stock,” the SKUs that are available to purchase on websites can drastically fluctuate based on strong demand or retailers having trouble stocking items. As designated on the right-hand axis, baby and child specific products and men’s grooming had very strong fluctuation in available SKUs with a coefficient of variation of over 10% whereas the average rate for the industries was just 6%.
- As companies compete at the global level for ingredient formulation and procurement, monitoring global supply chain performance can provide insights on categories to seek longer term supply chain strategy changes. With daily updates in Via, availability frequency metrics can be analysed at yearly, quarterly, monthly, weekly, daily, or customized time periods to identify supply chain disruptions.
Strong availability for Amazon’s US site compared to other countries
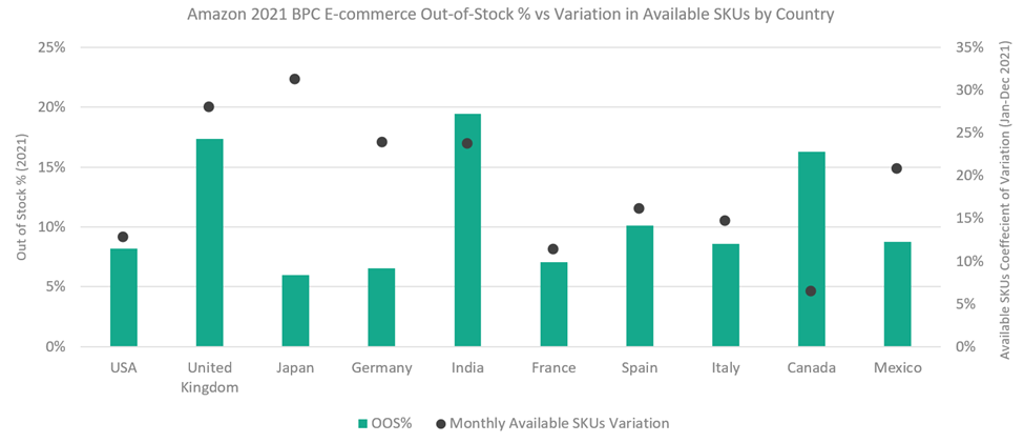
Source: Euromonitor International Via, Passport – Retailing. Countries ordered left to right by 2020 RSP sales for Amazon e-commerce sales
- Availability of BPC products within Amazon drastically varied across its leading markets, with US having both low percentages for out-of-stock as well as variation of available SKUs. Meanwhile, Amazon’s second largest market, the UK, was the third largest OOS, while also having a large variance in available SKUs, indicating shoppers face many availability issues.
- Within the leading markets, categories often have similar rankings across both availability metrics except for baby and child specific products. These products have very high OOS rates but only average changes in availability, indicating Amazon’s intent to inform potential buyers when products are out-of-stock versus simply removing the products from their site.
- Even large retailers like Amazon are susceptible to the market environment of each country they compete in and availability metrics can see drastic variation across markets. Companies must self-benchmark availability metrics from a variety of perspectives and manufacturers and retailers must work together and share resources in full transparency to help ease supply chain troubles.
Learn more about how Via can support your business and help you unlock key strategic and tactical insights with its standardised online product coverage across 40 countries, 1,500 online retailers and 11 consumer goods industries.