
With economies heavily dependent on natural resources for their operations and more stringent legislation coming into place, the protection of natural resources and the transition towards more sustainable production and consumption models has become a strategic imperative for corporate survival and success.
Sustainability is everybody's responsibility
As consumers, investors and stakeholders are starting to demand accountability for environmental impact, corporations are increasingly seeing the value of putting sustainability at the core of their business strategies, with the proliferation of businesses' voluntary commitments to support the achievement of the UN Sustainable Development Goals (SDGs). A common framework that paves the road towards a more sustainable future by 2030.
Eight of these goals (highlighted in grey) are related to environmental sustainability and directly connected to Euromonitor International’s Sustainability data on energy, pollution, water, natural disasters, climate change, forest and biodiversity, and agriculture. Euromonitor International’s Environmental Sustainability Index was built using this data to help businesses identify countries to implement more tailored sustainability strategies and enhance their environmental resilience.
The Sustainability Index provides an easy-to-understand country “scoring” system to quickly identify country-specific sustainability risks and opportunities, helping businesses become more sustainable in the markets where they operate or plan to expand.
Why an index?
Every industry has its own environmental challenges and opportunities depending on the markets where they source, manufacture and sell their products. Mapping and prioritising sustainability-related risks and opportunities across different markets is key to succeeding, attracting investors, ensuring good financial performance. Identifying these risks and opportunities also helps protect brand reputation and company operations as well as complying with, or even getting ahead of, legislation.
The Environmental Sustainability Index ranks 97 markets -which in 2018 represented 89.1% of the world’s population and 97.2% of global GDP – highlighting country-specific risks and opportunities in the sustainability space. The index can inform a sustainability strategy and help businesses and governments to map and understand sustainability issues by providing quantifiable metrics to a range of sustainability challenges, helping them to prioritise markets to focus sustainability goals to have the greatest impact.
Environmental Sustainability Index
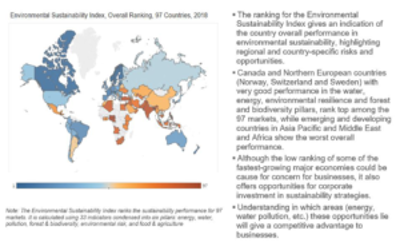
Source: Euromonitor International
The index breaks down into six pillars of equal relevance — energy, water, pollution, forest and biodiversity, environmental resilience and food and agriculture – at the core of sustainable development. Each of these pillars aggregates environmental indicators in different categories with their corresponding weighting based on their relevance to each pillar.
Understanding where the greatest needs and most impactful investment opportunities lie across the six core pillars is vital to prioritising sustainability investments. Countries with poor performance in any of the pillars offer opportunities for business to contribute towards certain SDGs. Companies operating in countries with good performance are at risk of losing consumer confidence and lagging behind competitors if they are not investing in sustainability strategies.
Best and worst performing countries across 6 key pillars
| Pillars | Best performers | Worst performers |
| ENERGY | The top five performers in per capita renewable energy capacity (Norway, Switzerland, Sweden, Canada and Austria) also lead the energy ranking | Countries with poor energy availability and equity in sub-Saharan Africa, such as Tanzania and Nigeria, and South East Asia such as Bangladesh and Myanmar are at the bottom of the table |
| WATER | With the highest score in renewable water resources, Canada, Norway and New Zealand are also the best performers in the water ranking | With scarce per capita renewable water resources, infrequent rainfall, and low water security, Kuwait and the UAE are among the three worst performers |
| POLLUTION | African countries such as Cameroon, Angola, Ethiopia and Côte d'Ivoire with low CO2 emissions from fossil fuels and low municipal waste generation –both in per capita terms – make the best performers in the pollution ranking | Singapore has the highest fertilizer consumption and per capita, municipal waste generation and stress rank last in pollution. Bahrain, Qatar, UAE and Kuwait follow with arid climate and poor, nutrient-deficient soils |
| ENVIRONMENTAL RESILIENCE | Eight European countries with good performance in global warming (and scored relatively well in the World Risk Index) are among the 10 most environmental resilient countries | Countries in Southeast Asia, such as Philippines and Bangladesh, and Central America, such as Guatemala, El Salvador and Costa Rica, with increasing frequency and intensity of natural disasters, are the worst performers in the environmental resilience pillar |
| FOREST & BIODIVERSITY | European countries with a small number of threatened species, relatively high forest coverage and a high percentage of their territory protected, such as Slovenia, Finland, Slovakia Sweden and Austria, lead the forest and biodiversity ranking | India, Indonesia and Pakistan –together home to 23% of Asia’s threatened mammals, fish and bird species, and 14% of the region’s protected areas— are among the worst performers |
| FOOD & AGRICULTURE | Australia, Singapore and South Korea score the highest in the food and agriculture pillar. | Ukraine and Egypt are at the bottom of the table |
Source: Euromonitor International from the Environmental Sustainability Index
To learn more about how our Sustainability data can help your organisation, request a demonstration.