
Despite governments, companies and institutions alike continuing to work on alleviating many cost-push and demand-pull factors, inflation continues to be a top-of-mind issue for consumers around the world. Based on numerous methods, companies should be continuing to identify and track the products that matter most to their customers and adjusting their pricing strategies accordingly. In our webinar, Inflation at Breakfast, we examined the different ways in which prices in a basket of goods can perform, and what that means for consumers, as well as how businesses can adapt.
Inflationary pressure not equal for product categories
Ready-to-eat (RTE) cereals has experienced high levels of inflation due to a multitude of reasons, but the biggest is the war in Ukraine, and the impact it has had on the global supply chain of ingredients. For example, in 2021 Russia and Ukraine produced 43% of global buckwheat output, 19% of rye, 18% of oats and 15% of wheat. As a result, the supply chain disruptions have had a drastic impact on global commodity prices, in turn inflating prices of packaged food products like cereal. Looking at the US market in particular, and using Euromonitor’s e-commerce tracking tool Via to monitor a basket of over 4,000 stock keeping units (SKUs), this showed the median unit price of RTE cereals increased by 20% in just a 12 month time period.
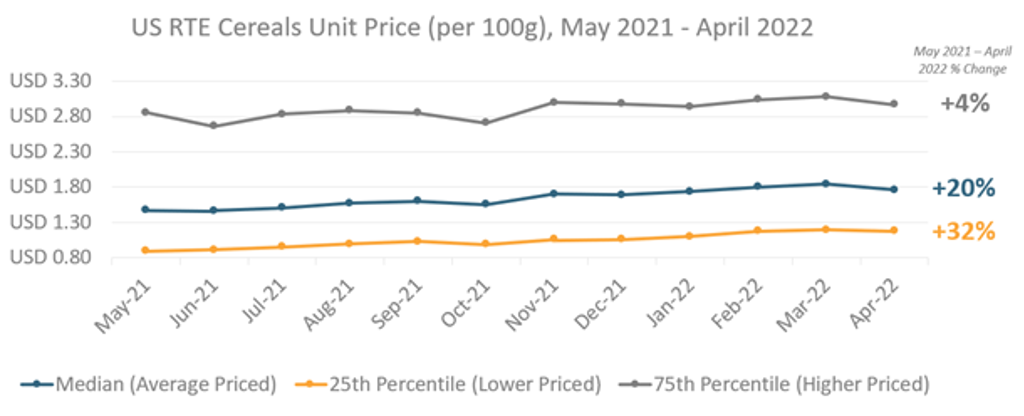
Note: Sample size of 4,103 SKUs
However, if one is only tracking median prices as an indication of how inflation is impacting consumers, it would not tell the real impact inflation can have on different consumers with different purchasing preferences. One method to uncover how prices are moving across different price levels is to use the 75th and 25th percentile points to serve as proxies for higher- and lower-priced products, respectively. For the US market, there was a drastic difference in how these prices performed. Higher-priced products saw only a 4% unit price increase during this time period, while lower-priced products saw a significant price increase of 32%. This can have a profound impact on consumers’ budgets, and means that consumers purchasing lower-priced RTE cereals during this time period saw their breakfast budgets for this staple rise disproportionately compared with those consumers purchasing higher-priced products.
Comparison of various price levels across different categories
As seen in the example of RTE cereals, monitoring changing price points across price segments is an important way to track inflation and how it impacts different consumers. Applying the same framework to a wider basket of breakfast categories showed that this increase in pricing was not unique to breakfast cereals.
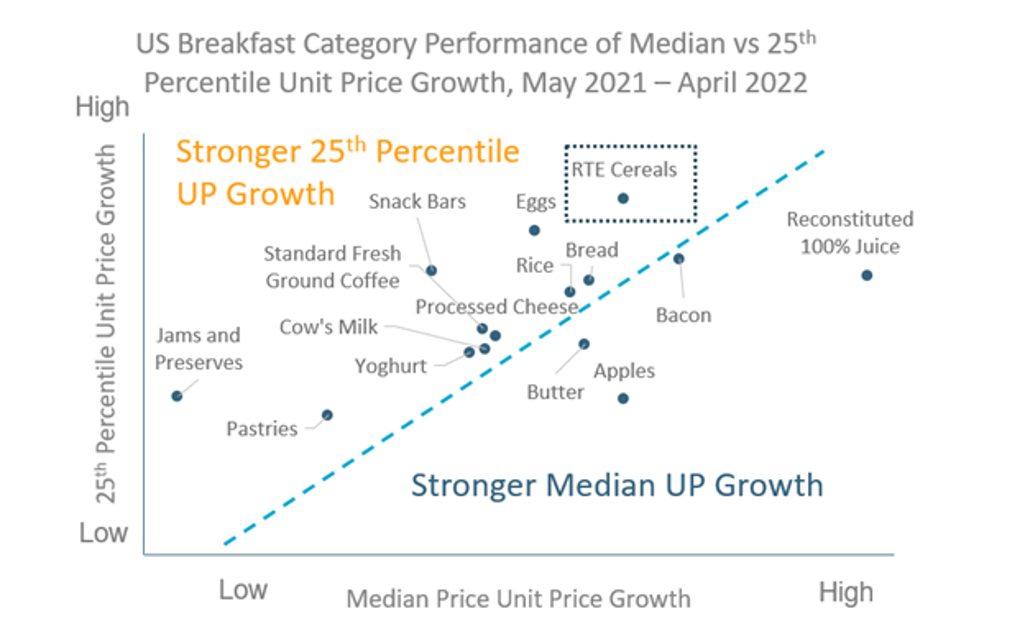
Note: Dotted line represents same 25th percentile and median unit price growth rate
Comparing median or average prices against the 25th percentile or lower-priced products for a basket of breakfast items showed that 11 of the 15 breakfast categories in the US saw unit prices of lower-priced products growing faster than the median unit price. While there are many commoditised products, such as butter, processed cheese and yoghurt, that are closer to the dotted line, indicating similar price increases between the lower and median price points, companies should closely watch this discrepancy in price increases across different price points, as there could be many opportunities to attract new consumers as previous pricing gaps narrow. For example, in some categories private label products have seen faster increases in unit prices versus branded products.
Supply chain availability needs to be tracked alongside price changes
Alongside monitoring the various price points of a product category, tracking supply chain availability metrics provides valuable insights, given the relationship between availability and changes in prices.
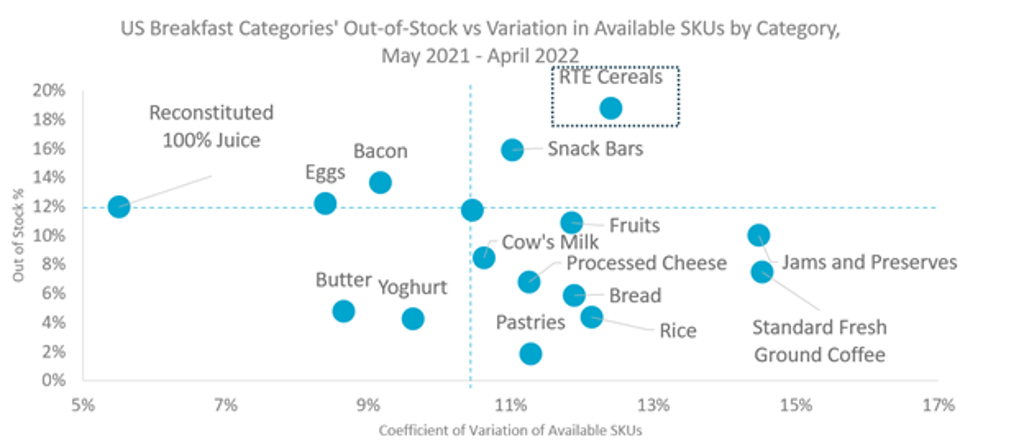
Source: Euromonitor International, Via
Note: Unweighted averages indicated by unlabelled centre dot
In the chart above, availability can be tracked by two distinct metrics, out of stock percentages and coefficient of variation of available SKUs. While out of stock percentage is simply based on the number of SKUs that are listed as out of stock by retailers, coefficient of variation provides additional insight by monitoring the changes in the total available SKUs that are available. This can be particularly helpful, as in many cases, when supply chains are under stress, retailers might remove certain SKUs rather than labelling them as out of stock. We can see in the chart above that butter, yoghurt and cow’s milk had strong availability online by both metrics, and this is due to the US having a stable supply of milk production during this time period. Conversely, RTE cereals SKUs being tracked in our sample not only had a higher than average out of stock percentage, but also had an above-average fluctuation of available SKUs. These availability struggles are a major reason for some of the price increases seen for RTE cereals. Tracking availability by a holistic set of metrics across a variety of product categories competing for the same resources can provide companies with key information to prepare for and react to supply chain disruptions.
Companies must prepare for further uncertain times
Businesses will continue to face challenging economic environments with hypersensitive consumer sentiment. But while inflation poses many challenges, it also opens up opportunities to enhance efficiency and innovation and adapt business strategy. Companies must first identify the shifts in consumer behaviour amid slower growth and higher inflationary environments. How are your customers going to be impacted financially by higher inflation? Which price points (75th versus 25th percentile) are your customers most likely to be impacted by? Second is understanding production cost dynamics. Given the importance of cost-push drivers on inflation, companies need to be informed on changes and be able to adapt across their value chains and look for alternative sourcing to reformulate products and build resilience. Finally, pricing strategy is paramount. An effective strategy allows businesses to navigate through this uncertainty, retain customers, and remain profitable. Tracking prices and availability at a daily level in a standardised manner from a global and local perspective provides key information to track one’s own portfolio, but also direct and tertiary competition, to make the right strategic choices.
For more information on how to track and monitor supply chain availability metrics or how to use Euromonitor’s e-commerce tracking tool Via to build your own basket of goods, such as for cereals or hygiene products to track inflation and availability, please to reach out to learn more. More information on the above analysis can also be found in the webinar Inflation at Breakfast.